Hard Dance Has SoundCloud's Most Active Audience [Data]
Hard dance and hardcore artists get 2.3x the plays per follower of techno at the same size. What 1,643 measured artists show about the scene's listeners.
Quick Answer
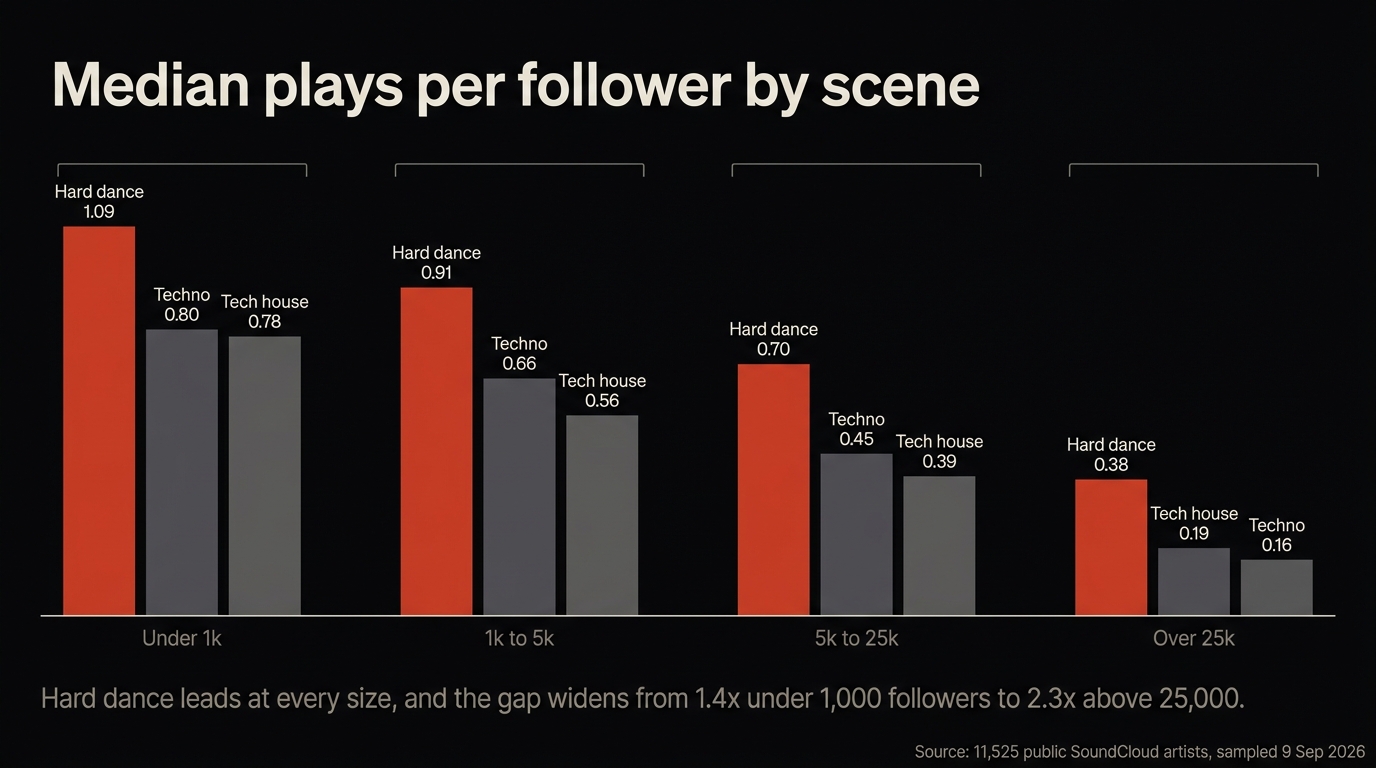
Hard dance and hardcore have the most active listeners on SoundCloud by a clear margin, and the advantage grows with size. Measured across 1,643 hard dance artists inside a larger sample of 11,525, the median hard dance profile gets 1.09 plays per follower under 1,000 followers, against 0.80 for techno and 0.78 for tech house. Above 25,000 followers the gap widens rather than closes: 0.38 for hard dance against 0.16 for techno — 2.3 times. The scene pays for that in a different currency, though. Hard dance has the lowest median like rate of the three scenes at every size, and the lowest comment rate, running about 0.6 to 0.7 times techno's. The audience listens more and reacts less, which means judging a hard dance profile by a platform-wide engagement benchmark gets it wrong twice over.
Everyone in the harder styles has felt this without being able to prove it: the audience shows up.
Smaller followings than the house and techno accounts around them, and yet the plays keep landing. Until now that was a feeling. We measured 1,643 hard dance and hardcore artists as part of a larger scene segmentation, and the feeling is correct — with a catch that is just as important.
The full tables live on the SoundCloud benchmarks hub. This is what they mean if the harder styles are your scene.
The Headline: Plays Per Follower
Plays per follower is the ratio of an artist's total plays to their follower count — how hard the existing audience actually listens.
| Followers | Hard Dance / Hardcore | Techno / Hard Techno | Tech House |
|---|---|---|---|
| Under 1k | 1.09 | 0.80 | 0.78 |
| 1k to 5k | 0.91 | 0.66 | 0.56 |
| 5k to 25k | 0.70 | 0.45 | 0.39 |
| Over 25k | 0.38 | 0.16 | 0.19 |
Median plays per follower by scene. Hard dance leads at every size, by 1.37 times under 1,000 followers and 2.28 times above 25,000.
The widening is the interesting part. In most scenes, plays per follower decays as an account grows — followers accumulate faster than catalogue plays, and casual followers dilute the average. Hard dance decays too, just far more slowly. A hard dance artist with 30,000 followers is still getting more than twice the listening of a techno artist the same size.
The Catch: They Listen More and React Less
The same scene sits last on the two visible engagement metrics.
| Followers | Like rate | Comment rate | ||||
|---|---|---|---|---|---|---|
| Hard dance | Techno | Tech house | Hard dance | Techno | Tech house | |
| Under 1k | 4.3% | 5.1% | 4.5% | 0.18% | 0.32% | 0.18% |
| 1k to 5k | 3.8% | 4.3% | 3.9% | 0.22% | 0.34% | 0.29% |
| 5k to 25k | 3.5% | 3.9% | 3.8% | 0.14% | 0.20% | 0.21% |
| Over 25k | 3.1% | 3.5% | 3.5% | 0.07% | 0.10% | 0.08% |
Medians as a share of plays. Hard dance is lowest or joint-lowest on like rate at every size, and its comment rate runs roughly 0.6 to 0.7 times techno's.
So the scene's audience is more active in the way that matters commercially — listening — and less active in the way that shows on a profile at a glance.
That combination is why a platform-wide benchmark misreads hard dance twice in the same direction. It flags the low like and comment rates as a problem, and it fails to credit the plays-per-follower advantage, because it has no scene comparison to credit it against.
What This Means If You Make Hard Dance
Four practical reads.
Stop treating your like rate as a verdict. At 3.5% with 12,000 followers you are at your scene's median. Against a platform average you look soft. You are not.
Your plays-per-follower is the number to show people. When a label or a promoter is assessing whether an audience is real, the ratio that separates you from a bought following is exactly the one your scene leads on. Lead with it.
Feed the ratio rather than the follower count. The scene's strength is listening volume, and the thing that produces listening volume is material in circulation — edits, IDs, unreleased tools. Putting those behind a download gate keeps the plays and converts them into contacts at the same time.
A falling ratio is still expected — measure the decay, not the level. Hard dance decays slower than the other scenes, but it decays. Going from 1.0 to 0.7 as you grow from 800 to 8,000 followers is normal.
Do not import a techno playbook wholesale. The scenes behave differently on the metrics and, more importantly, on the mechanics. Hard dance discovery runs through events in a way techno's does not — that is the argument in the hardstyle promotion guide, and the benchmark data is consistent with it.
How to Use the Ratio in a Pitch
The most practical consequence of this data is that hard dance artists have a number worth putting in front of people, and almost nobody uses it.
When a label, promoter or booking agent assesses a profile, the question underneath is always the same: is this audience real, or was it bought? Follower count cannot answer that. Plays per follower can, because a purchased following produces a very low ratio — the followers exist and never play anything.
So the line that does work in a pitch is not "I have 12,000 followers". It is "I have 12,000 followers and 0.7 plays per follower, which is the median for my scene at my size" — with the benchmarks hub as the source for the comparison.
Two cautions. Quote the median for your size group, not the headline figure, or the comparison flatters you and somebody will check. And remember catalogue size drives this ratio independently of scene: an artist with 400 tracks will show a low ratio for reasons that have nothing to do with audience quality, which is the separate finding in plays per follower.
Why the Audience Behaves This Way
The measurement does not explain itself, so this part is interpretation rather than data, and worth labelling as such.
The harder styles have an unusually strong scene identity. Fans identify with hardstyle, rawstyle or hardcore as a culture rather than as a playlist genre, and that shows up as repeat listening rather than as one-time discovery. A follower who plays a catalogue repeatedly generates a very different ratio from one who saved a track once.
The low reaction rate probably reflects the same thing from another angle. In a scene where the audience listens on repeat, the listening is the engagement — the like was given years ago, or never, because the relationship is not mediated through a feed.
Across the 2,400+ campaigns run by our founding team, scenes with strong identity and event-led discovery consistently show this shape: high consumption relative to audience size, modest surface engagement. Hard dance is the clearest example we have measured.
What It Does Not Mean
Three misreadings worth heading off, because a favourable statistic invites them.
It does not mean hard dance is easier to grow in. The ratio measures how hard an existing audience listens, not how fast an audience is acquired. A scene of a few thousand working artists is a smaller pond in absolute terms.
It does not mean the other scenes have fake audiences. Techno at 0.16 plays per follower above 25,000 followers is that scene's normal, driven partly by larger catalogues and partly by a broader, more casual following. Normal is not weak.
It does not transfer to other platforms. This is SoundCloud behaviour, measured on SoundCloud. Nothing here says a hard dance audience behaves the same way on Spotify, where the discovery mechanics and the listening context are different.
Across the 2,400+ campaigns run by our founding team, the fastest way to misuse a benchmark is to carry it somewhere it was not measured. This one describes one platform, three scenes, one date.
What the Sample Is
1,643 hard dance and hardcore artists, part of a 11,525-artist segmentation that also covers Techno and Hard Techno (7,184) and Tech House (2,698).
Each artist was classified from their own track tags, never inferred from a label. Each was measured across their whole readable catalogue, with the per-artist median taken before any cross-artist percentile, so no single viral track can move a band.
Four size groups rather than nine follower tiers, because a single scene cannot fill nine tiers at a defensible sample size — hard dance is only a few thousand working artists in total. The thinnest cell here holds 158 artists. Sampled 9 September 2026.
The limitation, stated plainly: the sample is our own reachable graph, snowballed through reposts and follows. It carries a follower floor and describes working artists rather than SoundCloud's long tail. These bands mean "typical for hard dance artists your size", not "typical for everyone".
Where the Scene Sits Overall
Pulling the three metrics together, hard dance is not uniformly ahead or behind — it is differently shaped.
| Hard Dance / Hardcore | |
|---|---|
| Plays per follower | Highest of the three scenes, at every size |
| Like rate | Lowest or joint-lowest, at every size |
| Comment rate | Lowest, around 0.6 to 0.7 times techno's |
| Repost rate | In line with the other scenes — reposts barely segment |
That shape is the argument for segmented benchmarks in one table. Averaged into a platform-wide figure, the strength disappears and the two weaknesses remain.
Frequently Asked Questions
Which SoundCloud scene has the most active listeners?
Hard dance and hardcore, measured by plays per follower. The median hard dance artist gets 1.09 plays per follower under 1,000 followers against 0.80 for techno, and 0.38 against 0.16 above 25,000 followers — 2.3 times the rate at the top size group.
Why is my hard dance like rate lower than other genres?
Because that is the scene norm, not a fault. Hard dance has the lowest median like rate of the three measured scenes at every size — 4.3% under 1,000 followers against techno's 5.1%, and 3.1% against 3.5% above 25,000.
What is a good plays-per-follower ratio for hard dance?
Compare within your size group. Medians run 1.09 under 1,000 followers, 0.91 at 1,000 to 5,000, 0.70 at 5,000 to 25,000 and 0.38 above 25,000. Note that catalogue size also drives this ratio heavily, independent of scene.
Does hardstyle count as hard dance in this data?
Yes. The scene bucket covers hard dance and hardcore broadly, classified from artists' own track tags, which is where hardstyle, rawstyle and hardcore releases land.
Why does the gap widen as accounts get bigger?
Plays per follower decays with size in every scene, because followers accumulate faster than catalogue plays. Hard dance simply decays more slowly, which is consistent with an audience that listens repeatedly rather than discovering once.
Is tech house or techno better for engagement?
Neither dominates. Techno leads on comment rate at almost every size and on like rate under 5,000 followers; tech house edges ahead on comment rate in the 5,000 to 25,000 band. Both trail hard dance on plays per follower at every size.
Should hard dance artists worry about comment rate?
Less than most. Hard dance comment rates run roughly 0.6 to 0.7 times techno's at the same size, and comment rate is the metric that varies most by scene. Judged against a platform-wide figure it will always look low.
The Bottom Line
The harder styles have been measuring themselves with the wrong ruler. On the metric that reflects whether an audience actually listens, hard dance leads every scene we measured, and leads by more as accounts grow.
It trails on likes and comments, which is what a platform-wide benchmark notices — and that mismatch is exactly why segmented data was worth building.
Full percentile bands for all three scenes are on the benchmarks hub. The cross-scene comparison sits in SoundCloud benchmarks by genre, and to place your own profile against your scene automatically, the free SoundCloud audit does the comparison.