SoundCloud Benchmarks by Genre: 11,525 Artists Measured
The first genre-segmented SoundCloud engagement benchmarks. Techno, tech house and hard dance measured separately, because one average misleads all three.
Quick Answer
Every SoundCloud benchmark published before now judges an artist against a single platform-wide average, which is a measurable error: scenes do not behave alike. We classified 11,525 public SoundCloud artists into three scenes from their own track tags — Tech House (2,698), Techno and Hard Techno (7,184), Hard Dance and Hardcore (1,643) — and measured each across their whole readable catalogue, taking the per-artist median before any cross-artist percentile so one viral track cannot distort a band. The scenes diverge most on the two metrics artists worry about. Under 1,000 followers, median like rate runs 5.1% for techno against 4.3% for hard dance, and techno's median comment rate is 1.8 times hard dance's. The gap narrows but never closes: at 5,000 to 25,000 followers it is still 1.4 times. Judged by a platform average, one of those scenes is always being told something false.
Benchmarks are only useful if the comparison group is real.
Every SoundCloud engagement figure in circulation — including the ones we published ourselves in August — compares an artist against a sample of the whole platform. That is fine as a first approximation and wrong in a specific, correctable way: a hard techno producer and a tech house producer with identical follower counts are not liked, reposted or commented on at the same rate.
So we measured the scenes separately. The full percentile tables are published on the SoundCloud benchmarks hub; this page explains what the segmentation actually shows.
The Sample
| Artists measured | 11,525 public SoundCloud profiles |
| Tech House | 2,698 artists |
| Techno / Hard Techno | 7,184 artists |
| Hard Dance / Hardcore | 1,643 artists |
| Classification | From each artist's own track tags — never inferred from a label |
| Reading depth | Whole readable catalogue per artist |
| Method | Per-artist median taken before the cross-artist percentile |
| Sampled | 9 September 2026 |
Two method choices matter for anyone citing this.
Scene comes from the artist's own tags, not from a label roster or a guess. An artist who tags their tracks as hard techno is counted as techno regardless of who released them.
The per-artist median is computed first. One track going viral lifts that artist's own median barely at all, and cannot drag the band their scene sits in. Benchmarks that pool every track from every artist are dominated by whoever had a big month.
The Headline Finding
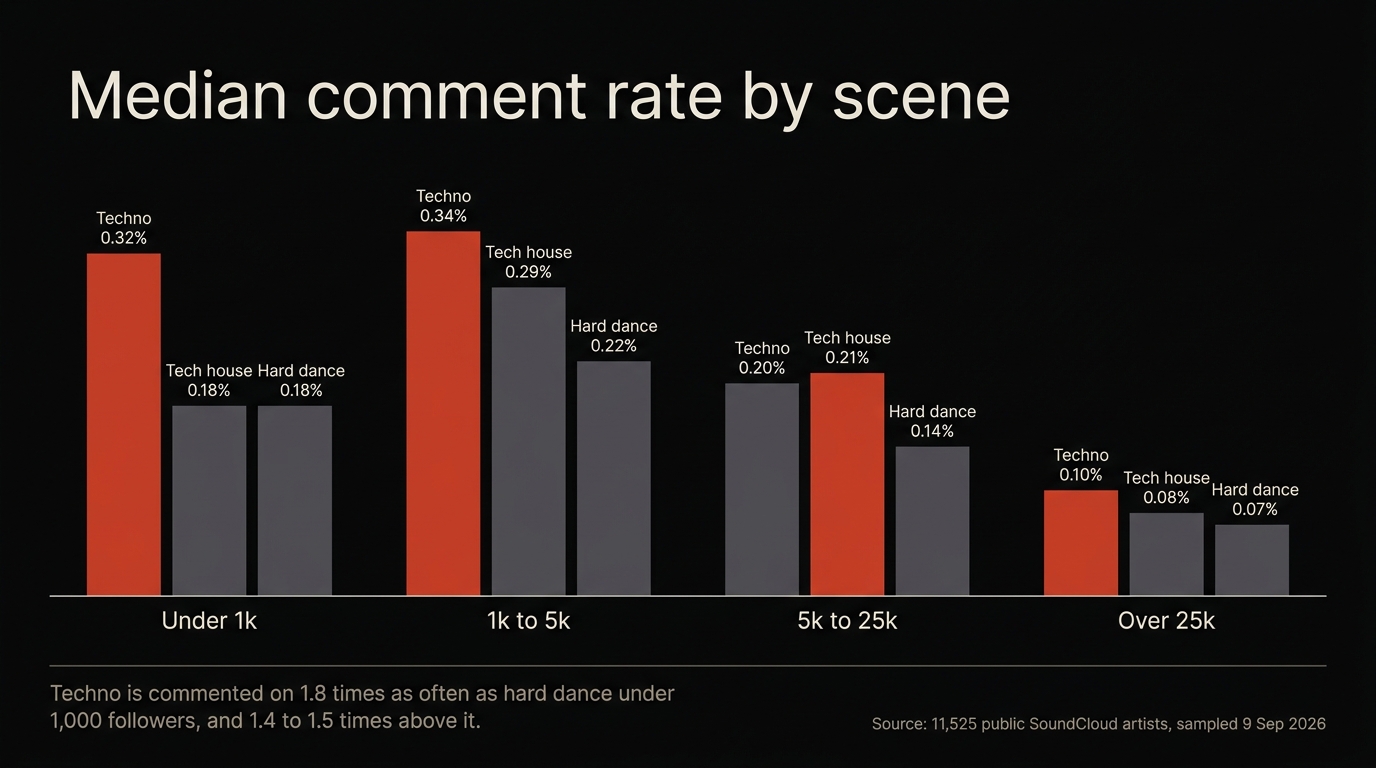
At the same follower count, scenes get commented on at materially different rates.
| Followers | Techno / Hard Techno | Tech House | Hard Dance / Hardcore |
|---|---|---|---|
| Under 1k | 0.32% | 0.18% | 0.18% |
| 1k to 5k | 0.34% | 0.29% | 0.22% |
| 5k to 25k | 0.20% | 0.21% | 0.14% |
| Over 25k | 0.10% | 0.08% | 0.07% |
Median comments as a share of plays. Techno runs 1.8 times hard dance's rate under 1,000 followers, 1.5 times at 1,000 to 5,000, and 1.4 times at 5,000 to 25,000.
Worth being precise about that, because the short version gets repeated carelessly: techno is roughly double hard dance only in the smallest size group. Above that it is between 1.4 and 1.5 times. Still a real gap, and still enough that judging one scene by the other's yardstick misreads a profile.
Like Rate Separates Scenes Too, but Less
Like rate is the most stable metric on SoundCloud — close to a platform constant, drifting gently down as accounts grow. Scene still moves it.
| Followers | Techno / Hard Techno | Tech House | Hard Dance / Hardcore |
|---|---|---|---|
| Under 1k | 5.1% | 4.5% | 4.3% |
| 1k to 5k | 4.3% | 3.9% | 3.8% |
| 5k to 25k | 3.9% | 3.8% | 3.5% |
| Over 25k | 3.5% | 3.5% | 3.1% |
Median likes as a share of plays. The scenes converge as accounts grow — a 0.8 point spread under 1,000 followers narrows to 0.4 above 25,000.
The practical read: like rate is the metric where a platform-wide benchmark does least damage. Comment rate is where it does most.
The Finding Nobody Expected
Plays-per-follower diverges by scene far more than either engagement metric, and it widens rather than narrows.
| Followers | Hard Dance / Hardcore | Techno / Hard Techno | Tech House |
|---|---|---|---|
| Under 1k | 1.09 | 0.80 | 0.78 |
| 1k to 5k | 0.91 | 0.66 | 0.56 |
| 5k to 25k | 0.70 | 0.45 | 0.39 |
| Over 25k | 0.38 | 0.16 | 0.19 |
Median plays per follower. Hard dance runs 1.37 times techno's rate under 1,000 followers and 2.28 times above 25,000.
That is the most useful number in the dataset and it was not what we went looking for. A hard dance artist with 30,000 followers gets more than twice the plays per follower of a techno artist the same size — the audience listens harder relative to its size, and the advantage compounds as the account grows.
It also means the single most common diagnostic in electronic music — "my plays look low for my followers" — cannot be answered without knowing the scene. We covered the catalogue-size half of that question in plays per follower; scene is the other half.
Why a Platform Average Misleads
The mechanism is worth spelling out, because it applies to every benchmark you will ever be handed, not just this one.
A platform-wide median is the midpoint of everybody. If scenes sit at genuinely different levels, that midpoint lands between them and describes none of them. Every artist in the higher scene is told they are ahead when they are average; every artist in the lower scene is told they are behind when they are also average.
Comment rate is where this bites hardest, because the scenes are furthest apart there and because comment rate is the metric artists treat as a verdict on whether anybody cares.
Worked through: a hard dance artist with 800 followers and a 0.18% comment rate is exactly at their scene's median. Read against the platform-wide bands they look like they are underperforming, and the usual response to that reading is to spend money fixing a problem that does not exist.
The reverse error is quieter and more expensive. A techno artist at 0.18% under 1,000 followers looks fine against a platform average and is in fact well below their own scene — a real signal, missed.
Repost Rate Is the Exception
One metric barely moves with scene, and it is worth saying so rather than implying everything segments.
Median repost rate sits between 0.21% and 0.38% across all three scenes and all four size groups. There is no scene that reposts dramatically more than another at a given size.
What repost rate does instead is move with size, and not in a straight line — it climbs into the 1,000 to 5,000 band and falls away above it, across every scene we measured. That shape is a platform behaviour rather than a genre behaviour, which is exactly why the platform-wide bands remain the right reference for it.
The practical consequence: segment your expectations for comments, likes and plays-per-follower. For reposts, size is the variable that matters.
What This Changes in Practice
Three things, in order of how much money they save.
Stop reading a platform average as your target. If you make hard dance and your comment rate is 0.18% under 1,000 followers, you are exactly at your scene's median. Against the platform-wide figure you look weak. You are not.
Judge plays-per-follower against your scene before your catalogue. A techno artist at 0.16 plays per follower above 25,000 followers is normal. A hard dance artist at the same number is well below their scene, and that is worth investigating.
Do not import another scene's expectations with another scene's playbook. Across the 2,400+ campaigns run by our founding team, the most expensive briefs are the ones where a target was borrowed from a genre that does not behave like the client's. The promotion sequences differ as much as the numbers do — compare the techno playbook with the hardstyle one and the divergence is obvious before you reach the benchmarks.
The Honest Limitations
Any benchmark you can cite should tell you where it stops.
Three scenes, not all of electronic music. House, trance, drum and bass, dubstep and the rest are not in this segmentation yet. If your scene is not one of the three, the platform-wide bands remain the better reference.
The sample is our reachable graph. It is snowballed through reposts and follows, so it carries a follower floor and describes working artists rather than SoundCloud's long tail. These bands mean "typical for artists your size in your scene", never "typical for everyone".
Four size groups, not nine. A single scene cannot fill nine follower tiers at a defensible sample size — Hard Dance is a few thousand working artists in total. Four wider groups keep every cell well populated; the thinnest is 158 artists. A gap would be printed rather than filled.
Sampled on one date. 9 September 2026. Engagement drifts, and a benchmark without a date is an assertion.
How to Cite This
The percentile tables, the method note and the sample sizes live on one page: otocracy.com/soundcloud/benchmarks.
Cite that page rather than this article — it carries the full bands at the 25th, 50th and 75th percentile for every scene and size group, and it is the page we keep current. Across the 2,400+ campaigns run by our founding team, the figures that survive scrutiny are the ones published with their sample size and date attached, which is why both are on it.
Frequently Asked Questions
What is a good engagement rate on SoundCloud by genre?
It depends on the scene and the size. Under 1,000 followers, median like rate runs 5.1% of plays for techno, 4.5% for tech house and 4.3% for hard dance; median comment rate runs 0.32%, 0.18% and 0.18% respectively. Compare within your scene and size group rather than against a platform average.
Do different electronic genres really have different engagement rates?
Yes, measurably. Across 11,525 artists, techno's median comment rate is 1.8 times hard dance's under 1,000 followers and still 1.4 times at 5,000 to 25,000. Plays per follower diverges further, with hard dance running 2.28 times techno's rate above 25,000 followers.
Which scene has the most engaged SoundCloud audience?
On plays per follower, hard dance and hardcore by a clear margin at every size, and the gap widens as accounts grow. On comment rate, techno and hard techno lead. They are different kinds of engagement, which is why a single composite score would hide the finding.
How were the genres classified?
From each artist's own track tags, never inferred from a label or a roster. An artist tagging their releases as hard techno counts as techno regardless of who put the record out.
Why four size groups instead of nine follower tiers?
Sample integrity. A single scene cannot fill nine tiers at a defensible size — hard dance is only a few thousand working artists in total. Four wider groups keep every cell well populated, with the thinnest at 158 artists.
Does this replace the platform-wide SoundCloud benchmarks?
No, it complements them. If you work in one of the three measured scenes, use the scene bands. If you work in house, trance, drum and bass or anything else not yet segmented, the platform-wide bands by follower size remain the better reference.
The Bottom Line
The finding is not that one scene outperforms another. It is that a single platform average tells at least one scene something false, and until now that was the only benchmark available.
Techno gets commented on more. Hard dance gets listened to harder relative to its following. Tech house sits between them on most metrics and below both on plays per follower at scale.
Full percentile tables, sample sizes and method are on the benchmarks hub. If you would rather have your own profile placed against your scene automatically, the free SoundCloud audit does the comparison, and the wider read is in SoundCloud engagement rate benchmarks. For a scene where circulating edits and unreleased tools are half the engagement, a download gate turns that traffic into contacts you keep.